I appreciate quick references and that’s where we are going to start.
ab -n 100 -c 10 -H "Authorization: API_KEY" https://www.linkedin.com/in/steve-pentler-8800aa60/
ab = apache benchmark
n  = requests (count)
c  = concurrency
H  = headers
What’s Apache Benchmarking? Why do I need it?
Apache benchmarking is a tool for developers to quickly measure response times at scale. If you’re maintaining an API, this can help you scientifically evaluate tradeoffs at lightning speed, and power your decisions with significant sample sizes.

“Why’s this cool?” I already have an analytics tool.
There are lot of blockers to getting code to an environment with analytics. We currently monitor only our staging/production environments with New Relic, but I work on a team, and staging isn’t always available. Even if I have the green light, it takes a minimum of 14 minutes to deploy. Running experiments with small sample sizes rarely tells the story, so I still have to spend time hitting the endpoint enough to generate a significant amount of data. Then I’ll have to figure out what to do for 10 minutes while the analytics platform collects data and rolls up reports. Why not increase that feedback cycle and recognize the optimization you nailed in development?
Apache benchmarking also encourages experimentation at scale. DDos your local system and test the outer limits without taking down production or invalidating key metrics in your analytics platform. I view New Relic as our team’s historical record of Truth, but running experiments with large sample sizes will alter this Truth and invalidate comparisons.
A Case Study:
During a front-end redesign, we made the decision to optimize the driving endpoint in our system, which also has the highest throughput. This endpoint was experiencing issues at scale, particularly while serializing data from one of the models. Our Rails V4 API utilizes Active Model Serializers(AMS) from the Rails Core Team, but fast_jsonapi from the Netflix Team made outrageous claims that it’s magnitudes faster. As a Rails fanboy I was skeptical, but curious enough to A/B test.
I began by ensuring each serializer received and returned the same exact data, so I would have a reliable comparison. You’ll notice the fast_jsonapi is syntactically very similar to ASM, but slightly more declarative. Turns out the guessing magic is what makes ASM slow, but I’ll save that for another post.

At this point I had yet to discover Apache benchmarking, so I was hitting the endpoint with single requests from an API client called Postman. The comparison seemed insignificant enough to chalk up to variations in network connectivity. Just before I ditched this spike effort, I happened upon Apache Benchmarking. It wasn’t an immediate success story, but at least I confidently confirm that AMS and fast_jsonapi were nearly equal in response times.
I moved on to address memory consumption issues we had been experiencing on our server, and recognized that were were loading two separate “one-to-many” associations. For example, our parent Model (Asset) needed to return a count of it’s children (files). These database joins were causing certain outlying queries to exhaust postgres memory attempting to return GB’s of data. So how could I get rid of these associations that loaded only to collect counts for display on the front-end? I moved the count data to a jsonb rollup field on the parent (Asset) and and created an async ecosystem to handle rollups.
With “rollups” implemented, I revisited AMS vs fast_jsonapi serializer debate. I was able to eliminate the has_many :files from both of the serializers. Both were faster, but more interestingly, the removal accentuated the difference between the serializers.

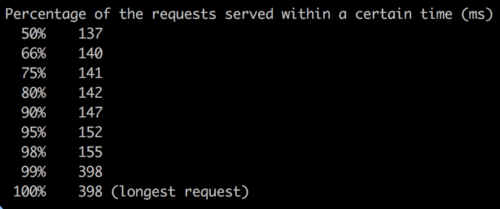
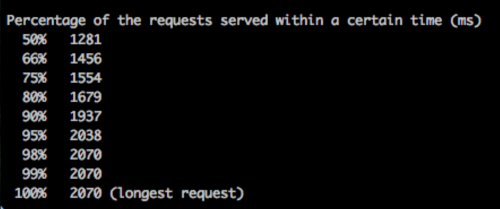
The AMS serializer (top) responded significantly slower than the fast_jsonapi serializer (bottom). Including the rollup, fast_jsonapi cut the top 50% of response times by about 700ms, and the top 99% response times by almost 1200ms! I seeded some more data and performed a test to return 13,000 serialized records and the results were even more obvious!

We fully implemented the fast_jsonapi with the “rollup” and pushed the optimizations up to production.
How about production? Did the analytics verify the hype?”
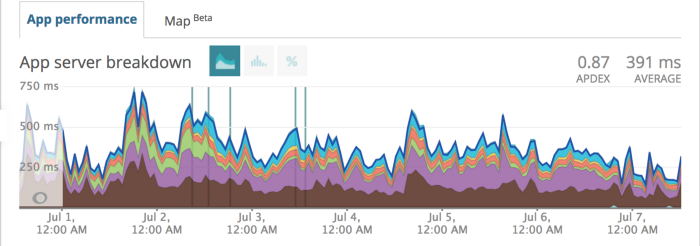
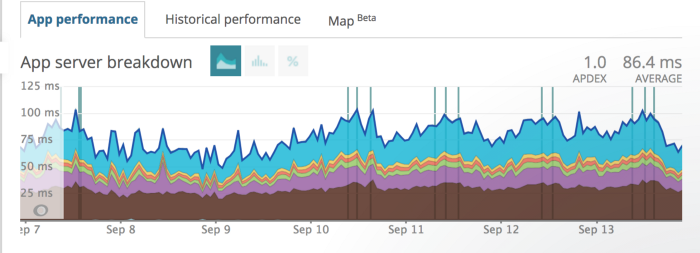
391ms => 86.4ms
391 millisecond baseline from the first week of July.

Now 86.4 milliseconds as of the first week of September!

Reports from Apache benchmarking helped us quickly optimize responses that are now 4.5x faster and more resilient to throughput.
Semi-Pro Tips for your experiment:
1. Take screenshots of everything and name them. If you don’t do this I promise you’ll forget your baselines and the results you’ve collected. Then you’ll have to rerun all the benchmarks to convince your team. Some example filenames I found:
ASM(1985ms)_Netflix(1281ms)_1000obj_1000n
2. Don’t DDoS yourself. Remember that this is a cool tool with real consequences when hitting production endpoints. I only put my LinkedIn profile in the initial example because I’m trying to eradicate it.
3. If your results are unbelievable fast, make sure you’re getting the correct HTTP response status. Don’t drop the mic just yet. Read the full printout and make sure the Non-2xx responses: are what you’d expect:

Shoutouts
I’d like to give a huge shoutout to the Apache Software Foundation. I know next to nothing about them and have no affiliation, but they seem like they’re creating useful tools with best intentions.
I’d also like to thank Brandfolder for supporting my experiments and teaching me the Way of the Webmaster.

