Overview
This post shares how we addressed a frontend performance issue users experienced with Brandfolder’s asset modal. Performance issues like this can be a huge pain to diagnose and fix. What follows is a retrospective of the actions we took to resolve the issue. Hopefully laying out these steps will help us and others when faced with frustratingly open-ended performance issues that require a fix.
tl;dr
Issue
We implemented React’s Context to house the state for our feature in one place and React Hooks’ useContext to consume it throughout the feature’s components. A pitfall, we found, is that any component consuming state with useContext will re-render when ANY piece of the Context’s state updates. This resulted in components that were totally divorced from one another causing each other to re-render. In cases where these re-renders were expensive, the memory in users’ browsers accumulated JS Heap footprints in the orders of gigabytes..
Resolution
We resolved the root cause of the issue by implementing React Hooks’ useMemo which allowed us to control when certain component trees rerendered. A more involved, architectural solution is to implement separate Contexts for separate parts of the feature, to avoid unintended rerendering.
Approach
By taking these steps we were able to resolve the issue:
- Identify: find specific user instances of the issue via customer reports and LogRocket sessions
- Reproduce: create the specific environment locally where the issue manifests
- Diagnose: bang on the local environment until we understand WHY the issue happens
- Fix: research relevant information discussing the problem and implement a solve
We spent a significant part of our time with the Identify and Reproduce pieces. While the process was by no means linear, it was crucial to definitively complete these steps. Once we could easily recreate the problem the Diagnose and Fix pieces fell into place fairly quickly.
Ultimately, we made the most progress in resolving the performance issue when we fulfilled a few items - identifying requirements for reproduction, reproducing locally, and employing development tools such as Chrome’s performance monitor, the React profiler, and the humble console.log to confirm our diagnosis and that our fix remediated the bug.
The Deets
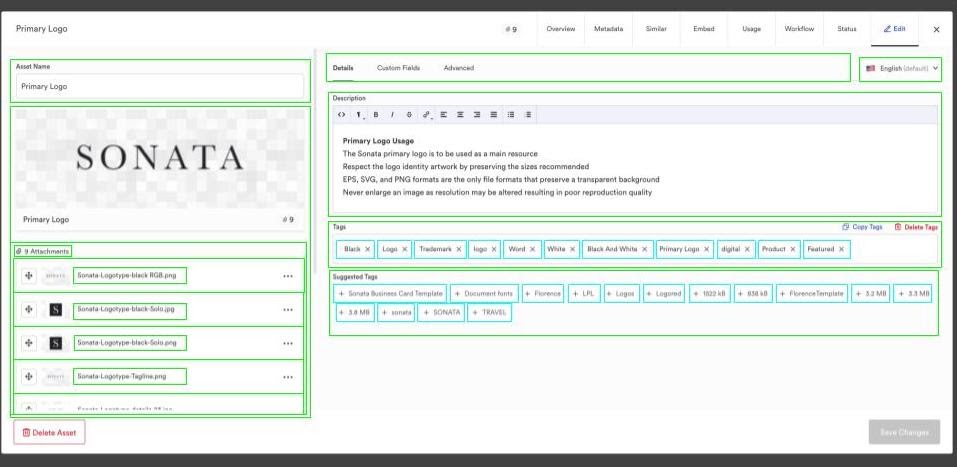
We recently rebuilt our asset edit experience, a key piece of our platform. In our update, we rebuilt the old modal that was rendered by Rails to instead use React hooks and Brandfolder’s API. Since we no longer submit the form data in bulk, we needed a way to identify which pieces of the asset had been edited to avoid submitting unnecessary updates. This required a complex state so we could make continuous comparisons between the initial state of the asset and the changes that had been made by the user. It was important to keep the state together at the top level of the component because distinct sub-components may impact each other.
Since an asset can be edited in several different ways, the display of the asset modal is complex as well, consisting of around 30 sub-components which are sometimes deeply nested. Given the need for a shared state across many components, we chose to employ React’s Context and useContext hook to avoid prop drilling.

The Deets: Identify
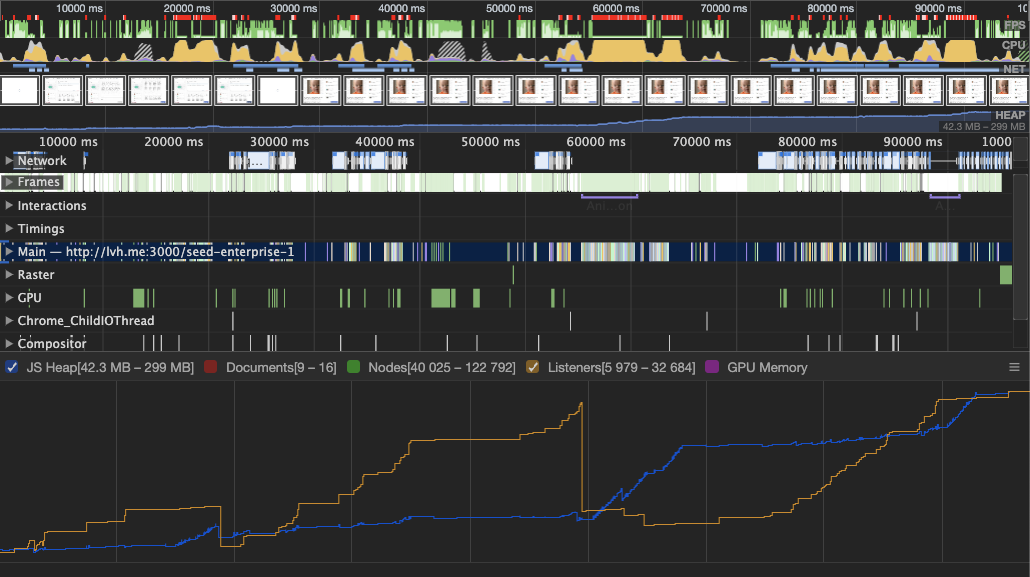
After launching the new edit experience, we began receiving intermittent reports of the edit experience running slowly and freezing. Taking a performance snapshot using Chrome DevTools’ Performance tab in production, we saw that there was significant growth in the browser JavaScript heap.

We needed a very specific reproduction of the slowdown. While we could trigger the heap spiking to some degree locally, we weren’t able to create a reliable reproduction until examining cases of the slowdown on LogRocket. LogRocket allowed us to dig into several instances of the performance issue occurring in production and identify all of the possible causes (user actions, asset features, asset properties, browser etc.).
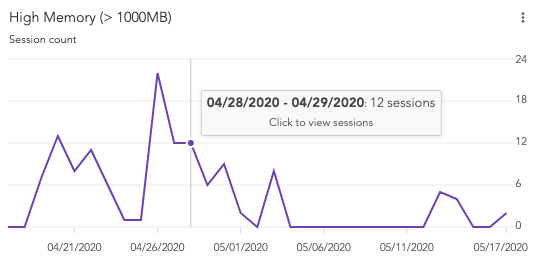
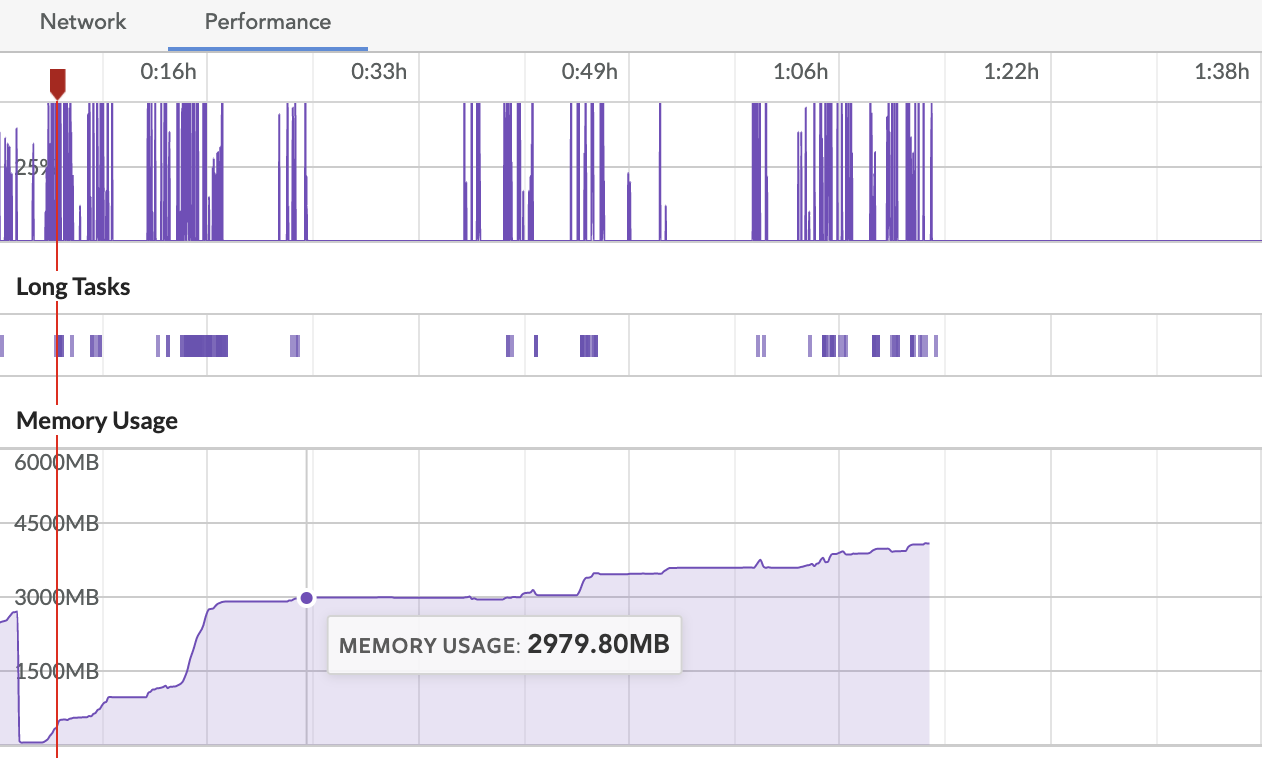
We had knowledge of at least one particular customer that experienced the performance issue and began by examining the network traffic and performance tab of their session. We saw a significant spike in memory (up to 3500MB) in this case. Given that, we searched for LogRocket sessions with average memory greater than 1000MB to attempt to identify commonalities.

We found that the slowdown often occurred when editing assets with significant metadata (tags and attachments) and that the memory typically spiked when the user edited the description section of the modal.

The Deets: Reproduce
Once we knew that a large number of tags or attachments were required to reproduce the bug, we set up a local environment seeded with 3,000 tags. Using Chrome’s performance monitor, we were able to view a memory spike of similar magnitude to the user cases in real-time while editing parts of the modal.

We replicated the memory spike when typing in the description area of the edit modal. Given that, we had a few guesses on what was wrong - something particular to the description WYSIWYG editor was causing problems or the problem existed on every text input, including the asset name input field.
The Deets: Diagnose
Ruling Out Possibilities
We started by examining the WYSIWYG editor. We had built our old jQuery WYSIWYG editor into our new React edit tab. We were already wary of potential bugs that could arise as a result of mixing jQuery and React. Our intuition was that the way the editor was instantiated with jQuery could lead to detached nodes sticking around after unmounting its containing component. Perhaps we were unwittingly creating a copy of the element every time the user typed in the description.
Ruling out this possibility proved to be quite simple- we replaced the WYSIWYG component with a simple, controlled textarea element. Once we did that, we still observed the memory spike so we were able to rule out potential issues with the jQuery WYSIWYG editor as the root cause of the performance issue.
We also saw the memory spike when typing into the asset name field. The performance issue was just more obvious with the description input because users typically input much more text into the description than the asset name. Given this, we suspected that the main issue was related to the fact that we update state with every keypress to compare initial data and the edit state to identify if changes have been made and how those changes must be submitted.
Asking the Right Question
Our assumption when designing the state in the way that we did was that since only the description box relies on the description string and only the asset name input relies on the asset name, the render on every keypress ought to be very cheap. Clearly, though, these renders weren’t cheap. So, the question became “why are the renders expensive?” Rather than using any particular development tool, we were able to most effectively understand the situation using good old fashioned console logging. Console logging proved to be so effective in this case because it allowed us to see which pieces were rerendering in real time as well as have a record of the renders.
We suspected that since the performance problem seemed to correlate with the number of tags and attachments that tags and attachments were getting unnecessarily rerendered. 100 tags meant 100 additional components to render. If those 100 additional components are rerendered every time the user types in the description, that would certainly account for the spike in memory and poor performance.
To get a clear line of sight into the render process we added a console.log statement to most of the subcomponents in the edit modal and started typing into the description. Every time we added a single character, we saw in the console that each subcomponent was rendered.
The Deets: Fix
Get Good at Googling
Ultimately we employed React Hooks’ useMemo method to control when component trees rerender. All this process and digging led us to employ Google with the finely honed query of “useContext react prevent rerendering children” that produced our solution. The first search result is a React issue where Dan Abramov offers three ways of dealing with our exact bug.
We went with Option 3 (useMemo) with a long term plan to employ Option 1 (use multiple contexts).
const AttachmentList: FunctionComponent = () => {
  const { dispatch, state } = useContext(assetModalContext);
  const { attachments } = state.editState;

  return useMemo(() => (

      {(attachments.map((attachment, i) => (
        <AttachmentListItem
          attachment={attachment}
          dispatch={dispatch}
          index={i}
          key={attachment.key}
        />
      )))}

  ), [attachments, dispatch]);
};
—
Of course the useMemo method is not a perfect solution- it creates a bottleneck in React’s elegant, declarative flow. It already bit us once (just days after implementing our solution) when a downstream component was not updating when it should have updated because we omitted a key dependency from the useMemo dependency array.
Additional Info
- Robin Wieruch’s post offering a primer on React Context
- React useContext documentation
The documentation for
useContextdoes mention the behavior of rerendering the component any time any piece of the context changes by noting that
A component calling useContext will always re-render when the context value changes. If re-rendering the component is expensive, you can optimize it by using memoization.
The reason this led to our particular experience is stated by Dan Abramov in a more obvious way in this React GitHub Issue
useContext doesn’t let you subscribe to a part of the context value (or some memoized selector) without fully re-rendering

